Pull up two market trackers for Jensen Beach on the same afternoon this month and you can walk away with opposite conclusions. One tells you prices dropped double digits over the past year. Another tells you the typical home has climbed steadily for five straight years. Neither is wrong. They're just measuring different things, and the gap between them is the actual story for anyone comparing Jensen Beach against other stops on the Treasure Coast right now.
If you're shopping Jensen Beach against Stuart, Vero Beach, or Port St. Lucie this fall, you've probably already seen the headline figure: home prices down around 10 percent. What almost nobody explains is what's producing that number, and why the answer changes what you should actually do with it.
The Number Everyone Is Repeating
The most-cited version comes from a three-month window ending in May 2026, showing Jensen Beach's median sale price at $425,000, down 10.7 percent from the same period a year earlier, with homes selling in an average of 57 days compared to 78 days the year before. A separate tracker looking at July 2026 shows the median price per square foot down 9 to 10 percent year over year to $328, with days on market stretching to 91.
Those two numbers alone don't agree with each other on how fast homes are moving, let alone on price direction being uniform across the market. That's the first clue that "Jensen Beach prices are down 10 percent" is doing more work as a headline than as a fact.
What Five Different Trackers Actually Measured
Widen the lens and the disagreement gets larger, not smaller. Here's what a same-season snapshot looks like across sources:
| Source | Metric | Figure | Window |
|---|---|---|---|
| Median sale price tracker | Sale price | $425K, down 10.7% YoY | 3 months ending May 2026 |
| Price-per-square-foot tracker | Price/sqft | $328, down 9-10% YoY | July 2026 |
| Closed-sales tracker | Closed sale median vs. active median ask | $413K closed vs. $489K asking | Trailing 6 months, as of Aug 31, 2026 |
| Weekly list-price index | Median list price | $574,450, rising | Week of July 21, 2026 |
| Quality-adjusted home value index | Estimated typical value | ~$417,034, up roughly 5% annually over 5 years | As of June 2026 |
Read across that table and notice what the closed-sales tracker spells out on its own: the $413,000 figure and the $489,000 figure come from two separate groups of properties, the ones that already sold versus the ones currently for sale, not from buyers negotiating sellers down. A citywide median built from whatever happened to close in a given window will swing based on which homes happened to sell, not on whether values are rising or falling.
The Building That Explains the Whole City's Headline
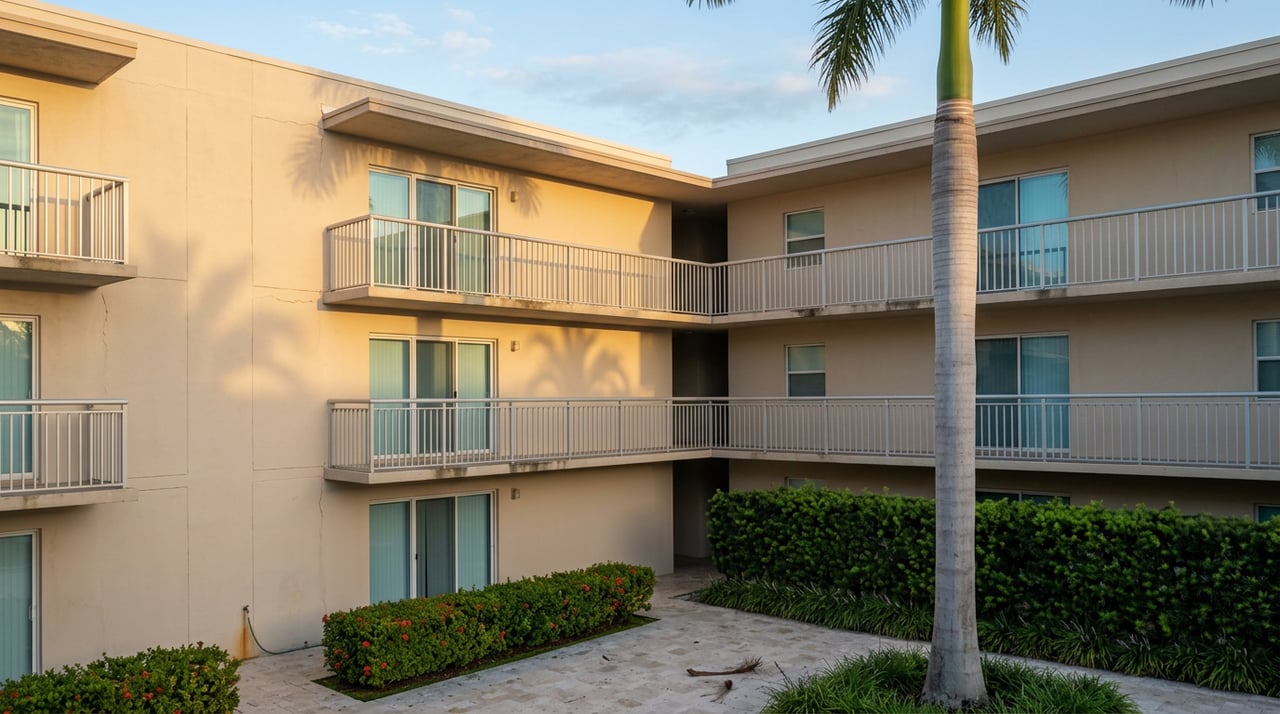
Zoom into a single Jensen Beach condo building and the mechanism becomes obvious. Jensen Beach Club Condo, a small oceanfront building in the city, showed a median sale price of $288,500 over the trailing twelve months, down 10.5 percent year over year, built from eight closed sales in that window.
Eight sales. That's not a market trend. That's a sample small enough that one distressed seller or one estate sale can move the median by five figures.
The building's own market data makes the point directly: a swing of that size in a building this thin says more about which eight units happened to change hands than about any actual shift in what the building is worth. A single building with a sample that small can produce a double-digit headline that has nothing to do with whether it, or the city around it, is losing value. Roll enough thinly-traded condo buildings into a citywide median, alongside a handful of high-end waterfront closings that happen to fall out of the window, and you get exactly the kind of headline number circulating right now.
The Counter-Number Nobody's Citing
Here's the part that rarely makes it into the same conversation. A quality-adjusted home value index for the same zip code, which weights for the type and condition of homes rather than just averaging whatever happened to close, puts the typical Jensen Beach home at roughly $417,000 as of June 2026, up about 5 percent annually over the past five years.
That's not a rounding difference from "down 10 percent." It's a fundamentally different read on the market, and it's the one that should carry more weight if you're trying to understand what a specific home is actually worth rather than what happened to trade last quarter. The same scorecard also flags Jensen Beach as expensive relative to local incomes, which is a separate and legitimate concern for affordability, but it's not the same claim as "prices are falling."
Nettles Island Shows Why "Median" Breaks Down Here
If you want to see why a single citywide number struggles to describe Jensen Beach, look at Nettles Island. It's a roughly 1,578-lot community on a man-made spit of land connected to A1A by Nettles Boulevard, technically part of Hutchinson Island but carrying a Jensen Beach mailing address. What began as a campground in the late 1960s has grown into a mix of custom homes, mobile homes, manufactured homes, Key West-style homes built on stilts, and RVs, all governed by a single condo-style homeowners association with monthly fees generally running in the low $300s.
Try to average a sale price across that inventory and you're blending a $150,000 RV lot with a renovated concrete-block home on the same street, under the same HOA, subject to the same amenities. That's an extreme version of the same problem playing out citywide: when the product mix shifts, from more condos closing one quarter to more single-family waterfront the next, the median moves even when nothing about underlying value has changed.
What This Means If You're Comparing Jensen Beach to Other Treasure Coast Towns
Before you let a citywide percentage decide where to shop, run through this:
- Ask how many closed sales sit behind any percentage you're quoted. A move built on eight to twenty transactions is a sample-size story, not a market trend.
- Separate condo data from single-family data before comparing anything. They've been moving on different timelines this year, and blending them erases the signal.
- Compare a home to its street and building, not to the city median. A well-kept, updated home near the water tells you almost nothing about a dated inland condo, and vice versa.
- Look for a value trend over several years rather than a single year-over-year percentage. The quality-adjusted five-year trend and the one-year closed-sale swing are answering different questions, and only one of them tells you what a specific property is likely worth going forward.
- If a community mixes product types the way Nettles Island does, ask specifically what has sold in your exact product category, not the community average.
A Few Questions Worth Asking Directly
Why do different sites show such different prices for the same city? They're measuring different baskets of homes over different windows: closed sales versus active listings, single-family versus condo-heavy segments, three-month snapshots versus five-year trends. None of them are lying. They're just answering different questions.
Is a 10 percent single-year decline something to worry about as a buyer or seller? It depends entirely on what's inside that number. If it's built from a handful of condo closings in a thin-sample building, it says less about the broader market than a multi-year, quality-adjusted trend does.
Does a mixed-product community like Nettles Island complicate financing or comps? It can. When a single HOA governs custom homes, manufactured homes, and RVs together, comps need to be pulled from the matching product type, not the community as a whole, and buyers should confirm financing terms match the specific structure they're purchasing.
The Takeaway
The citywide number making the rounds this fall isn't false. It's incomplete. Jensen Beach in 2026 has a condo segment working through a genuinely thin, choppy sales window and a broader single-family and waterfront market that's held up far better on a quality-adjusted basis. Anyone comparing this stretch of the Treasure Coast against Stuart, Vero Beach, or Port St. Lucie deserves the version of the story that separates those two markets instead of averaging them into a headline.
If you're weighing Jensen Beach against another Treasure Coast neighborhood and want the comp pulled at the building or street level instead of the citywide median, Renny Realty can walk through the actual closed sales behind any number you've seen and help you figure out what it means for the specific property you're considering. Schedule a consultation and bring the listing you're comparing.